Weather modelling · evidence summary
A month of model weather leaves a reusable record.
The task is to turn an initial-value experiment into a readable lifecycle, rather than deliver an unexplained directory of model output.
The research prompt
Original research prompt
Run a very simple CESM simulation, should be 1 month, think about the simplest quickest way to see some interesting physics
31 model days, ready to inspect.
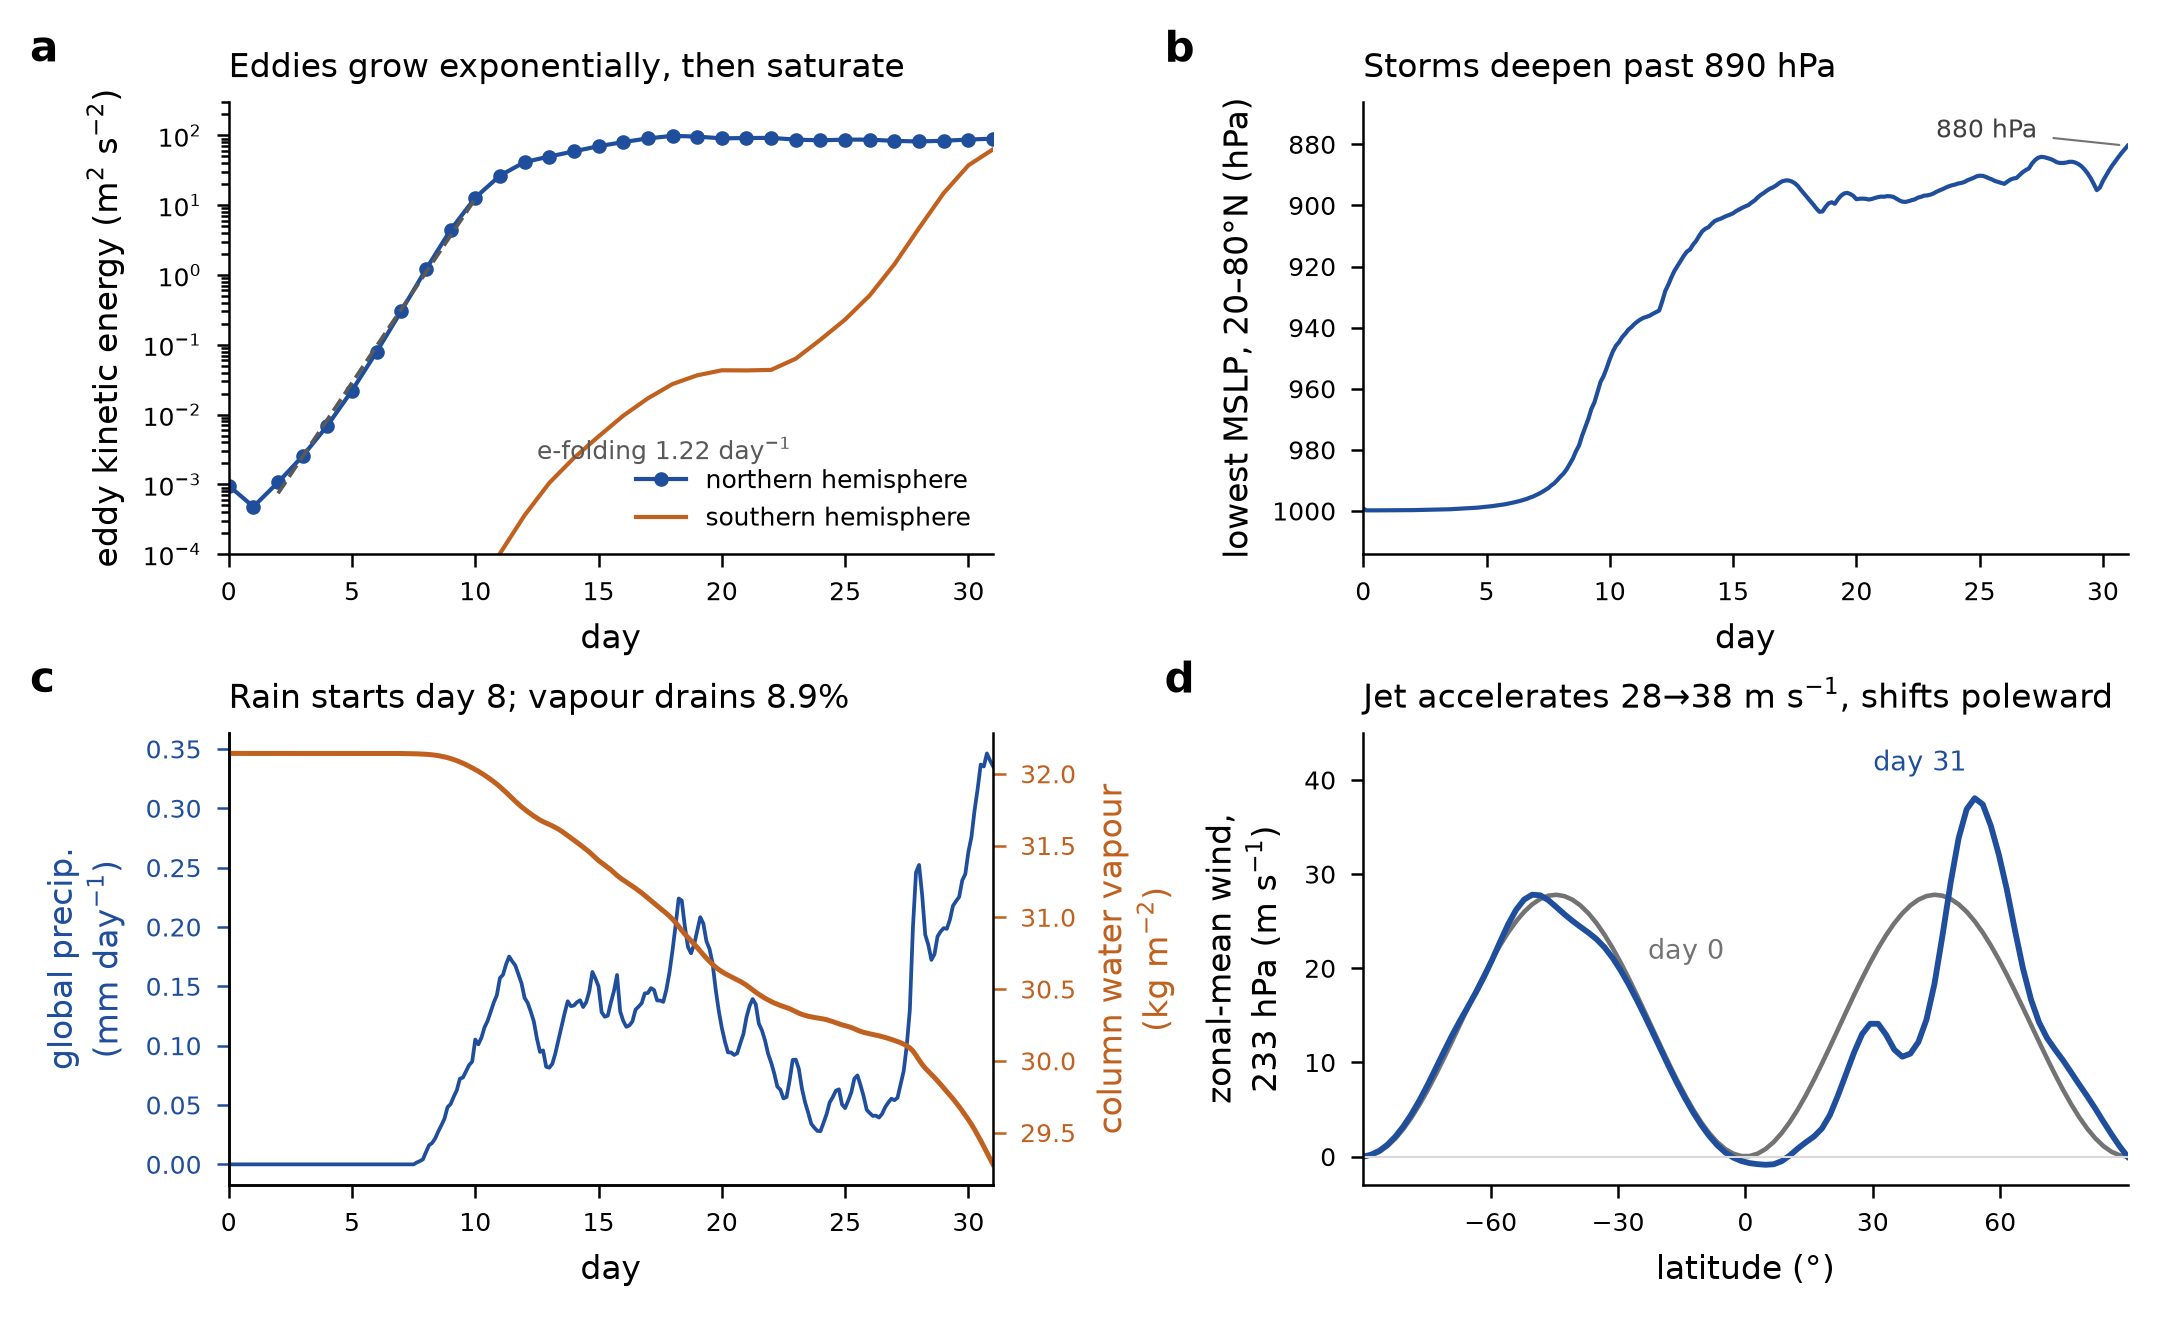
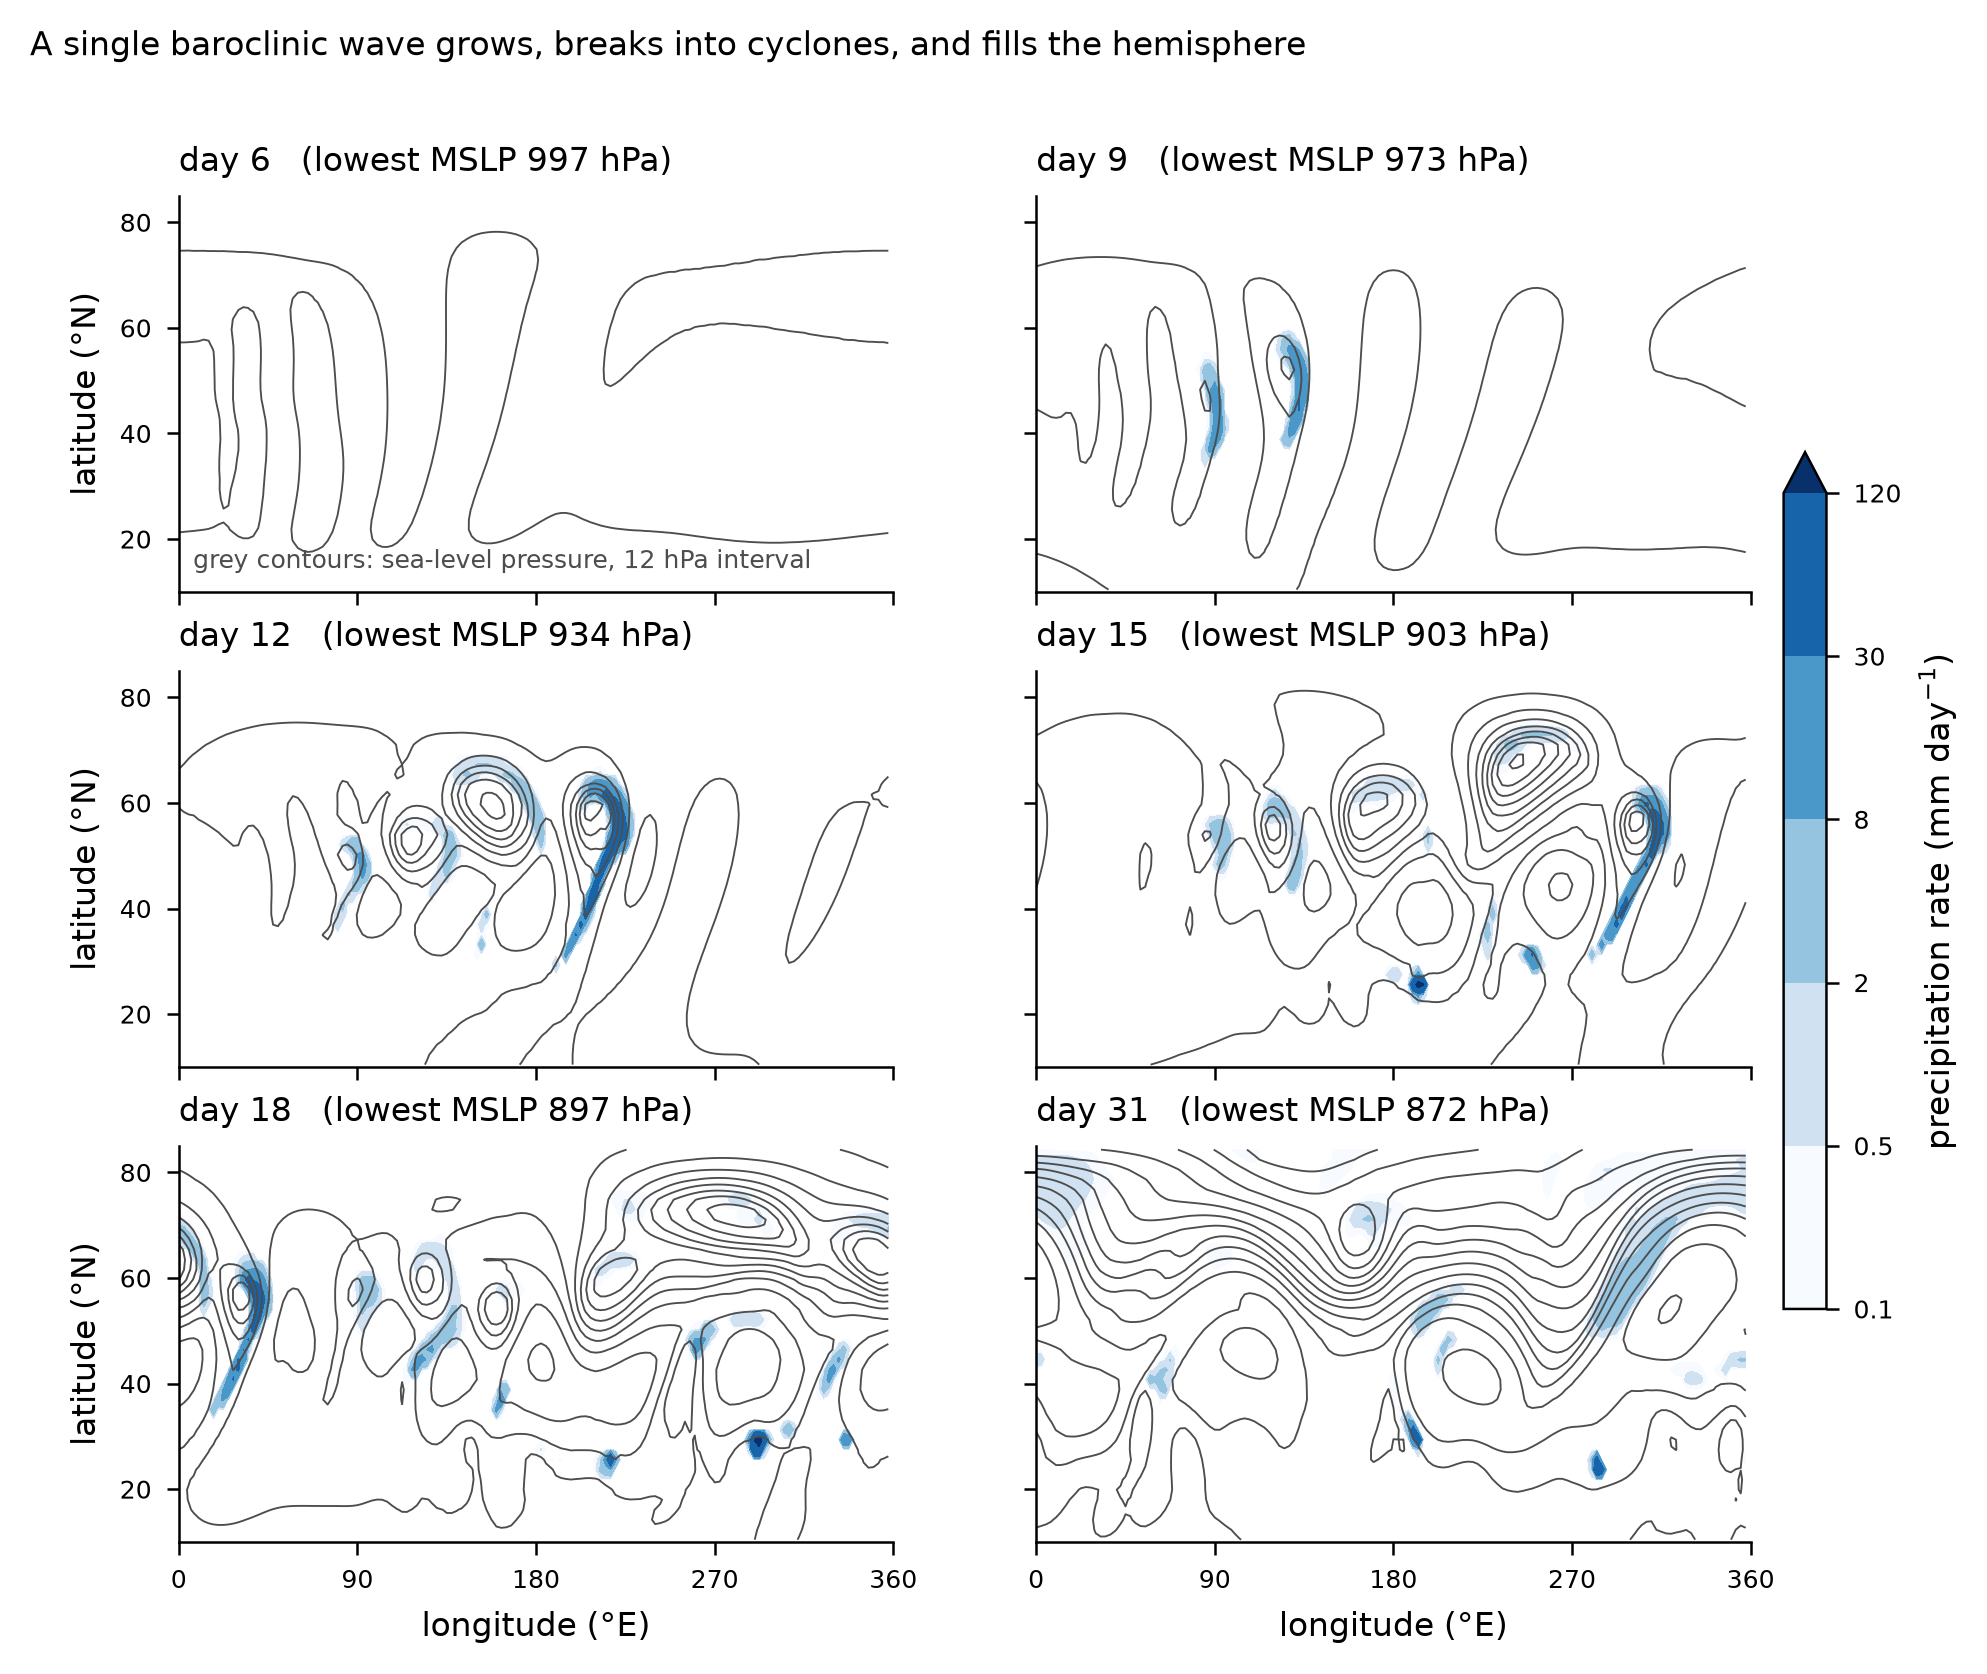
The recorded study produced 249 diagnostic samples at three-hour intervals, two charts, and an explanatory movie connecting the evolution of the atmosphere to its underlying dynamics.
Simulated duration, not elapsed work. The original lifecycle figure retains a stale pressure label; this is not a real-world forecast.
The recorded investigation
Choose a bounded demonstration
The user asked for a simple one-month run with interesting physics and little spinup. The recorded configuration uses idealized FKESSLER dynamics.
Extract a month of evolution
The supplied timeseries has 249 three-hourly rows from model day 0 through day 31, plus a separate zonal-jet table.
Produce the visual handoff
The six supplied files include an explainer script, two CSVs, two charts and the original movie.
Where the conclusion stops
- This finite initial-value experiment omits radiation, an evolving ocean and surface friction; it is not a climate equilibrium or forecast.
- The original lifecycle figure contains a stale final-pressure label.
- The jet CSV refers to 250 hPa, while the source diagnosis identifies a level near 233 hPa.
- The recorded 94-second model execution excludes the approximately 10-minute build, analysis and rendering. It does not measure human time saved.
The next useful test
Align all captions with the final numerical data and specify the pressure level before scientific reuse.
Selected scientific files
These files support inspection of the study. They are not a complete package of run inputs, dependencies or raw outputs. Scientific scripts are provided for reading; this website does not execute them.
- baroclinic_wave.py
- fig_diagnostics.png
- fig_wave_lifecycle.png
- fkessler_timeseries.csv
- fkessler_zonal_jet.csv
- one_month_of_weather.mp4
This is an editorial evidence summary of a recorded investigation, including later requests and review. The prompt animation is a presentation of saved work, not a live simulation. Human time saved was not measured.