Atmospheric physics · evidence summary
From a splitting storm to a testable explanation.
A research team wants a working storm example and a physical explanation of its behaviour. A colourful map can show a storm splitting, but it does not explain which assumptions control its strength, motion or rainfall. The useful next decision is which features a simple model can represent and which need fuller three-dimensional dynamics.
The research prompt
Original research prompt
create a sample WRF weather simulation
A simulated storm. A simpler explanation to compare.
Two simulated hours in WRF became a storm-splitting investigation, followed by a reduced physical model and a paper comparing selected diagnostics.
One idealized WRF atmosphere, not a real-world forecast. Agreement varies by diagnostic; the source paper retains rainfall-window and vorticity-caption inconsistencies.
The recorded investigation
Turn six words into a working virtual experiment
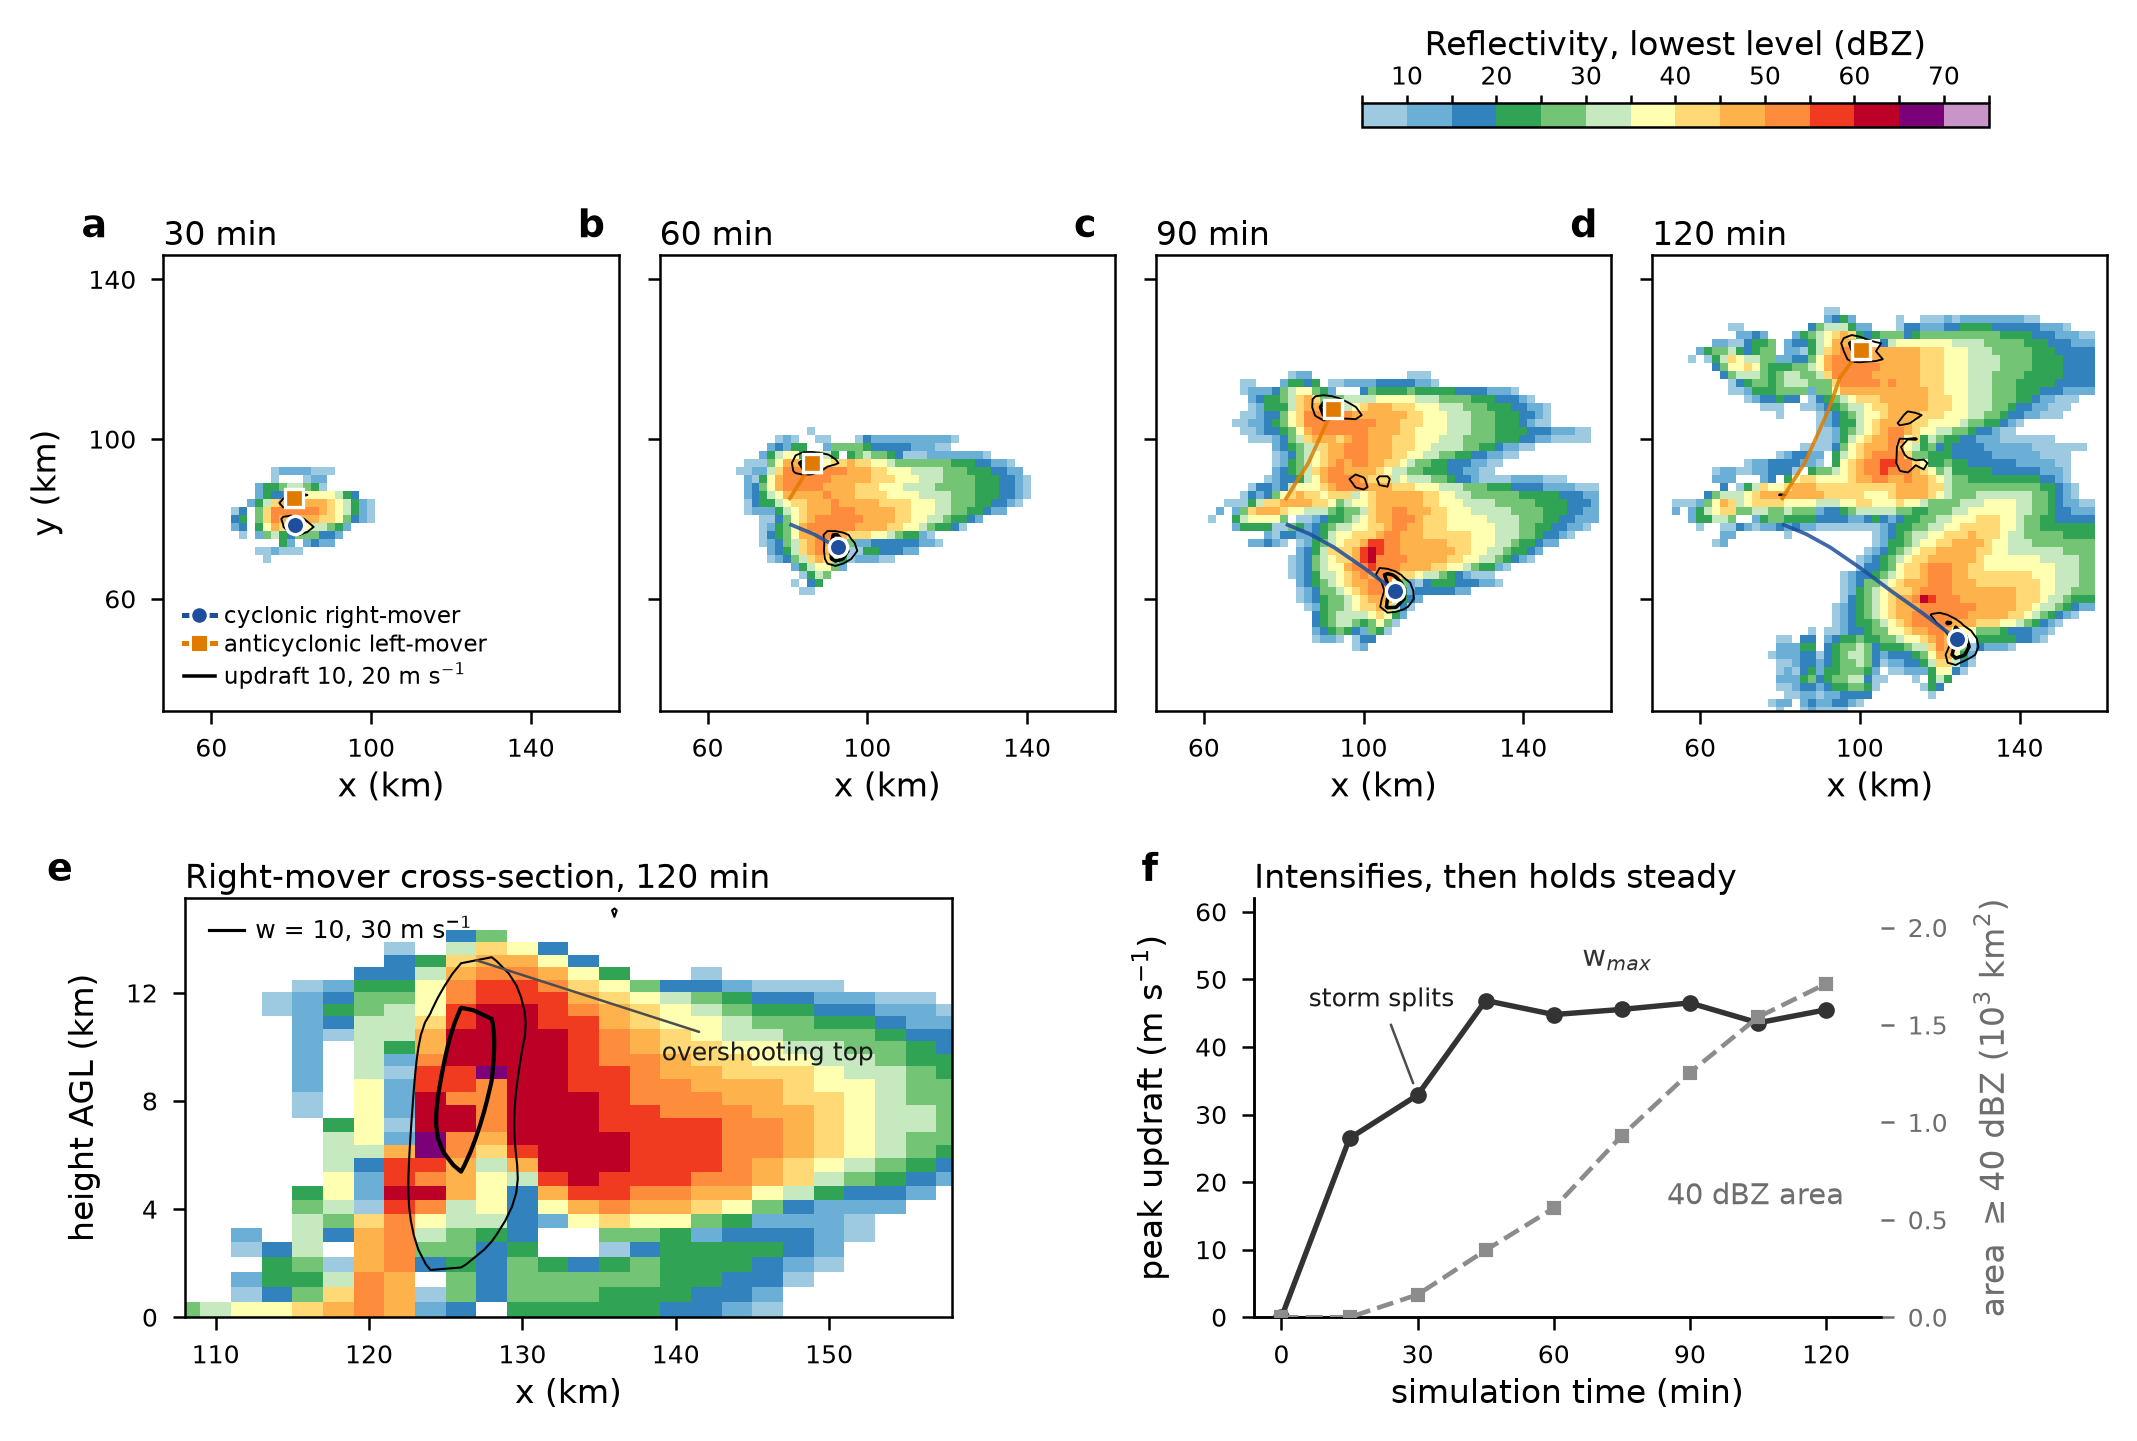
The initial request was “create a sample WRF weather simulation”. Laplace selected WRF’s existing quarter-circle-shear supercell test, repaired a source-build dependency problem and ran the model on the available cluster. A warm bubble in a prescribed atmosphere develops into two storm cores with opposite rotation. The diagnostic series reaches a peak instantaneous updraft of 46.9 m/s at 45 minutes and a maximum accumulated rainfall of 64.5 mm at two simulated hours. These are outputs of the idealized case, not observed weather.
Ask the simulation a second question: why?
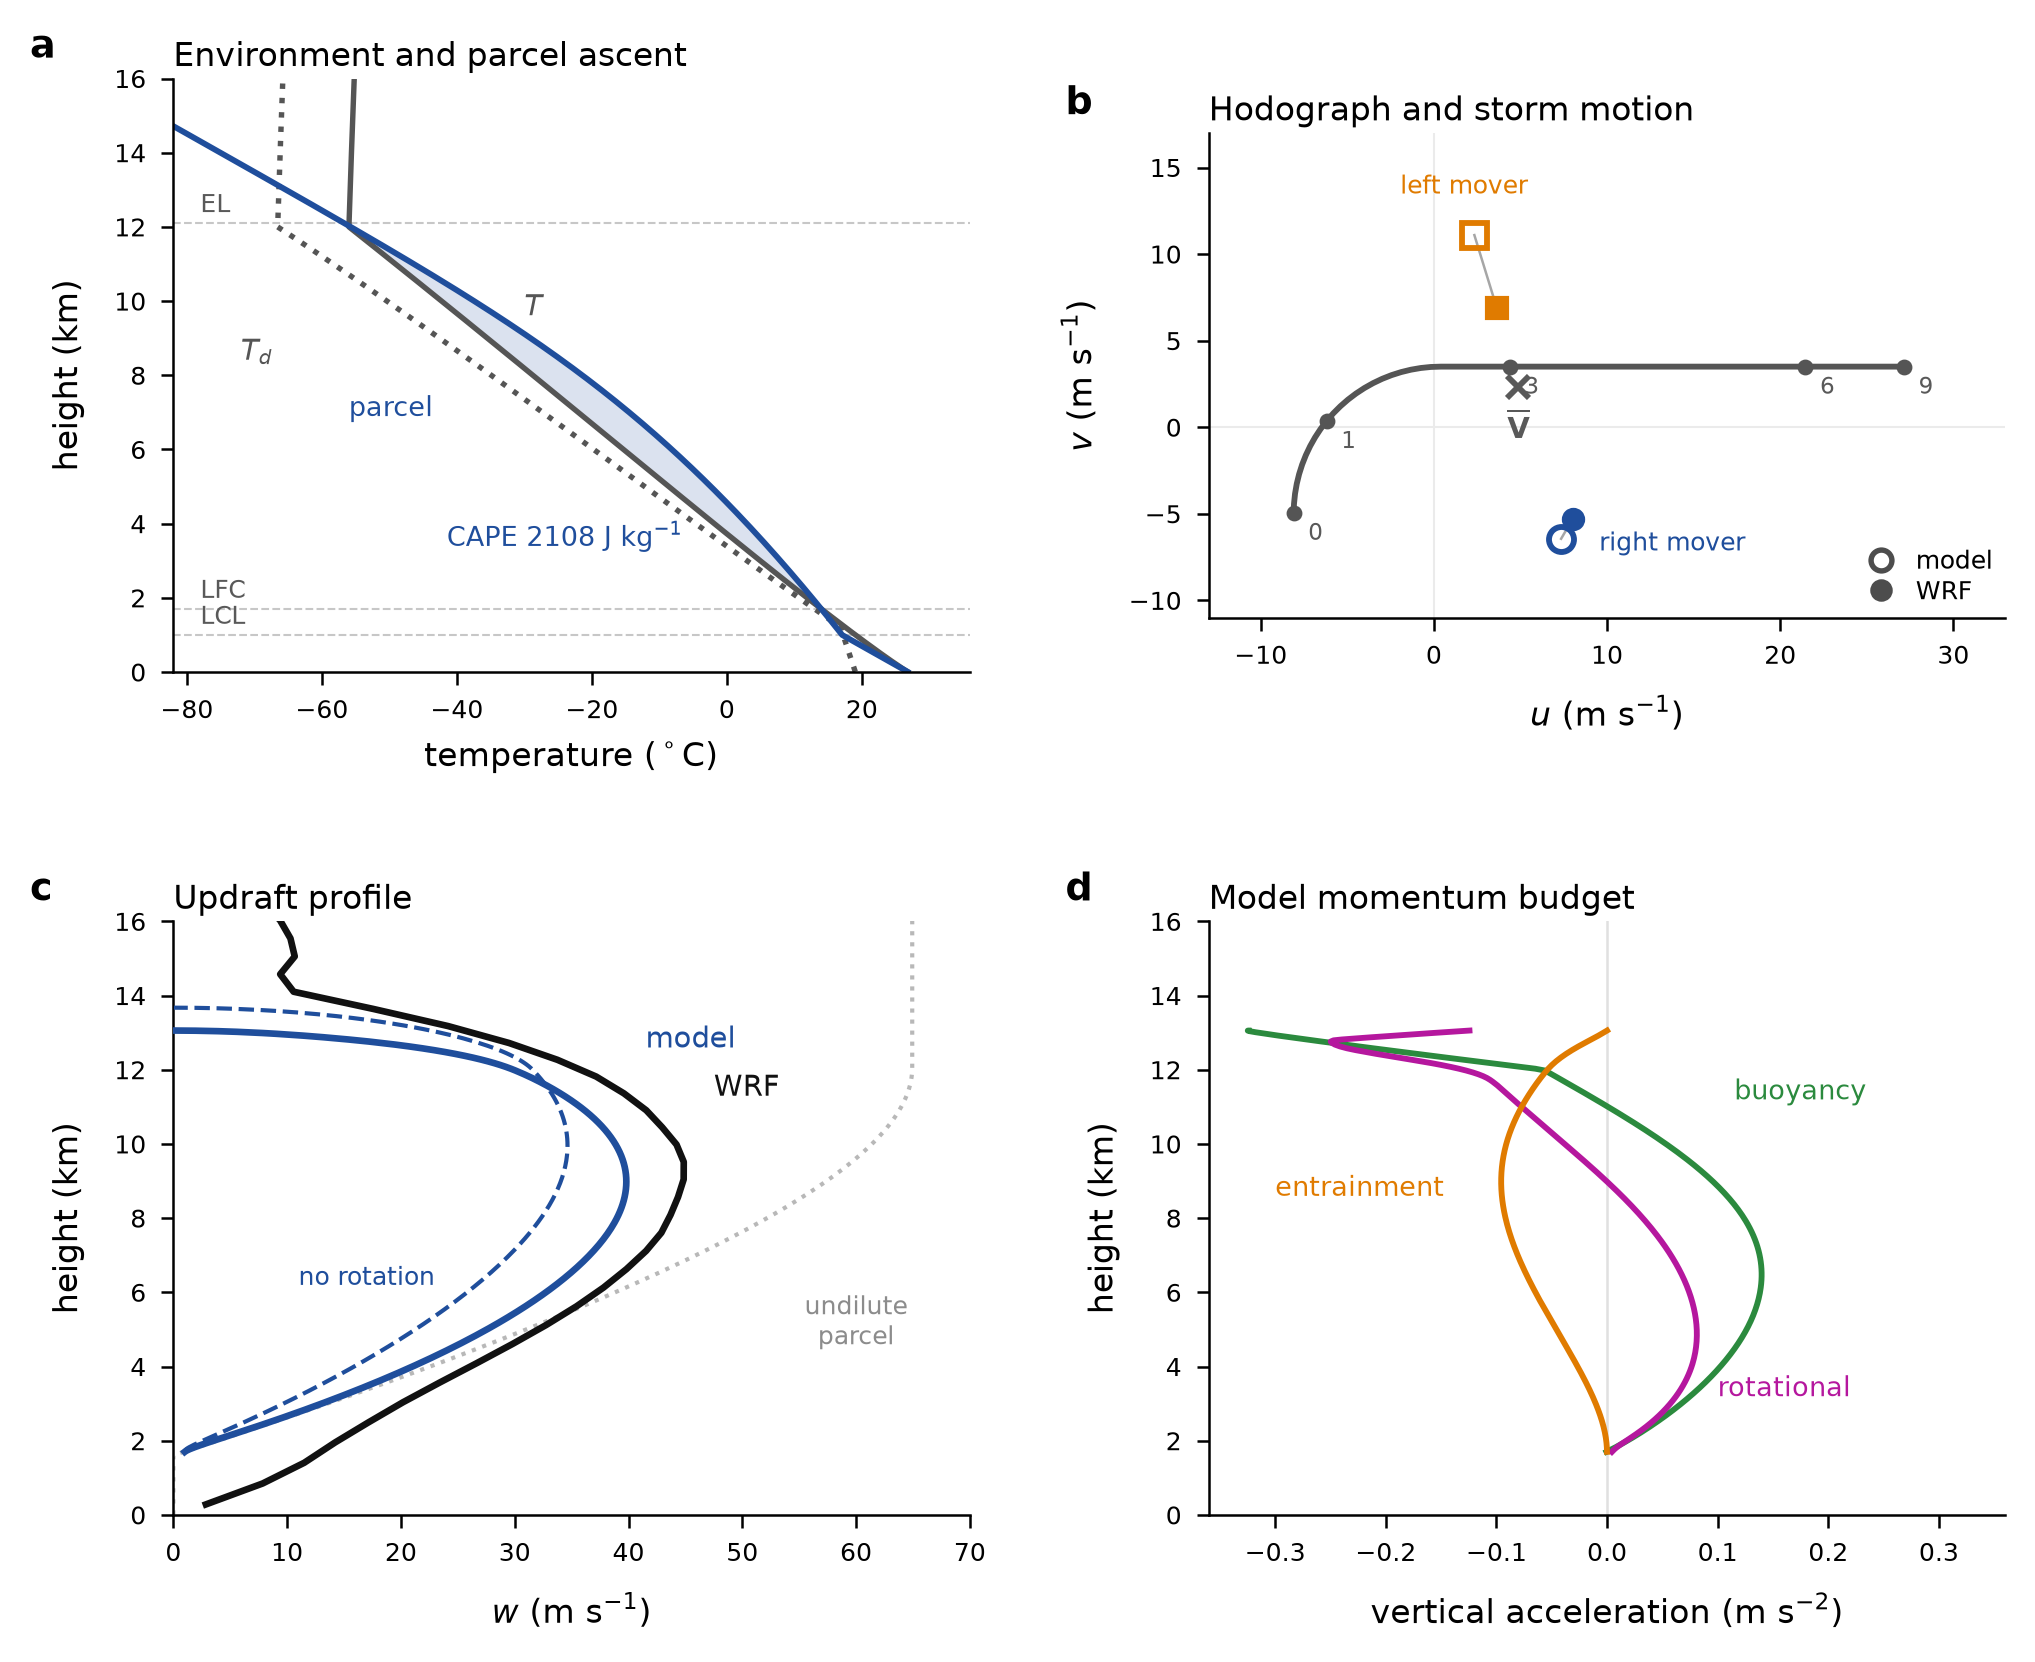
The user then requested an analytical first-principles explanation and a paper. Laplace assembled a reduced plume model using the initial temperature, moisture and wind profile, with assumptions for mixing, water loading and rotation. It produced a 39.8 m/s peak updraft against 44.9 m/s in the mature WRF profile. Removing the rotational contribution lowers the reduced-model result to 34.6 m/s. That creates a testable explanation within the model: quantify what a mechanism changes, then compare it with the richer simulation.
Keep the mismatches in the story
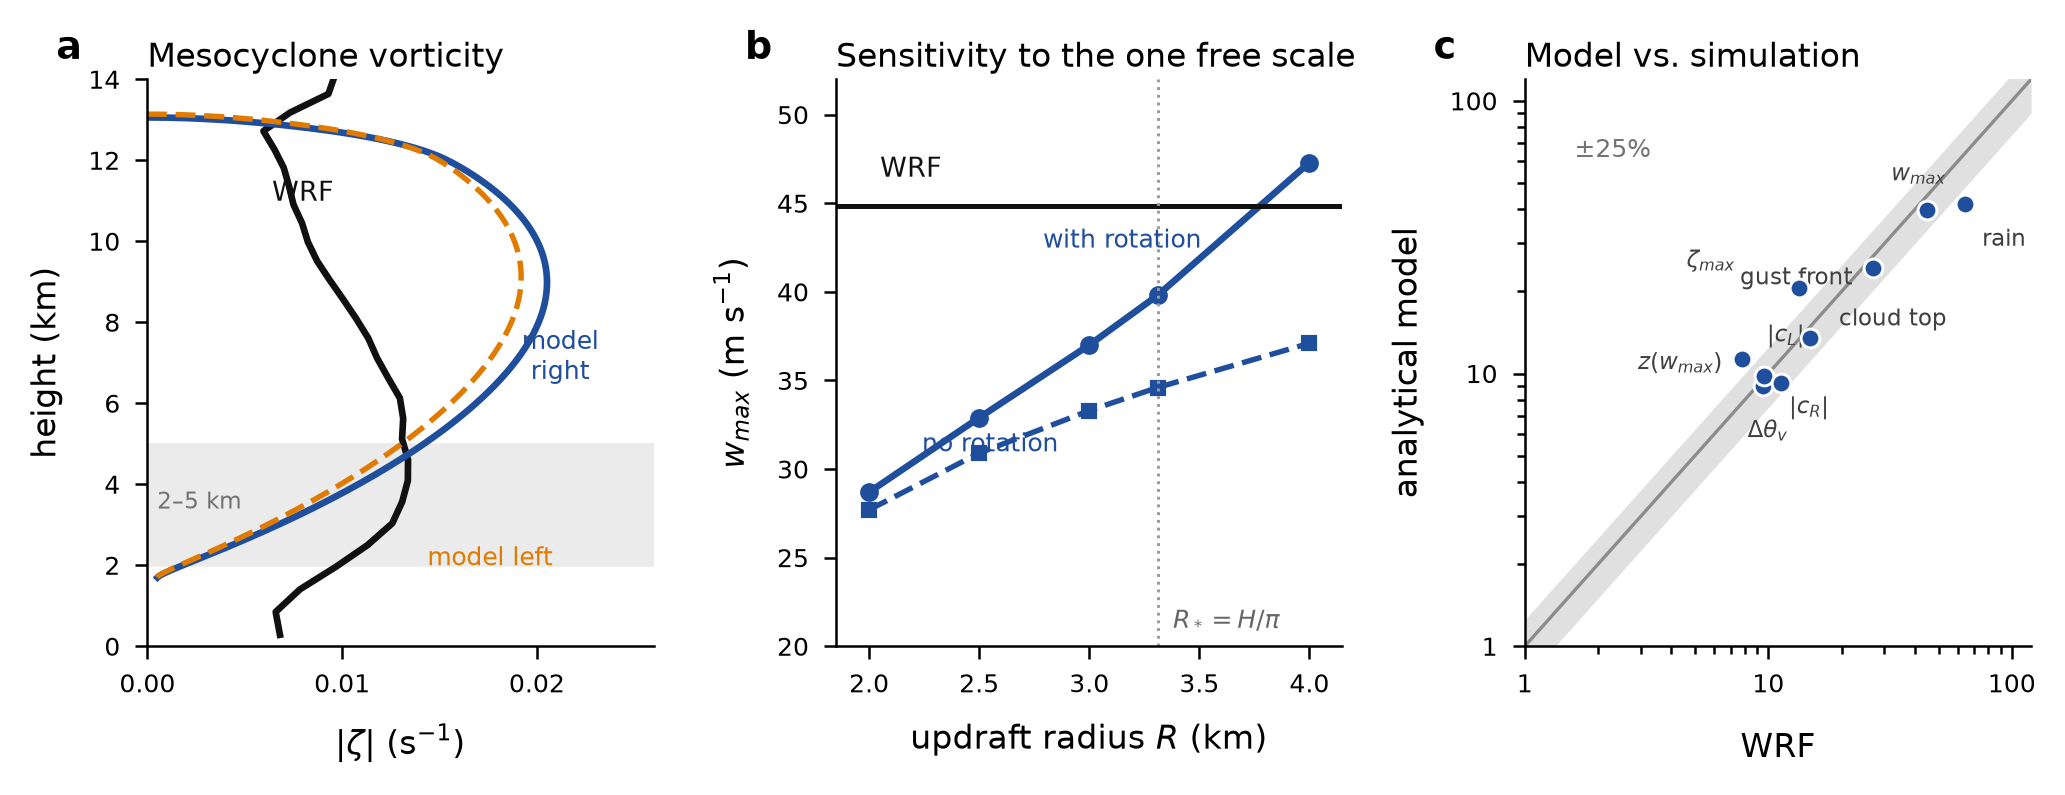
The simpler model comes close to the right-moving storm’s speed, but overestimates the left-moving speed by about 46% and peak vorticity by about 53%. Its storm-area growth is about 62% too low. Review corrected the reported rotation ranges and the storm figure. A rainfall table still compares a 90-minute model accumulation with a two-hour WRF total. The result is a useful research package with visible unresolved questions; the manuscript’s broad accuracy language goes beyond what this one case establishes.
Where the conclusion stops
- This uses WRF’s existing idealized supercell test, initialized from an analytic atmospheric profile and a warm bubble. It is not a new forecasting engine or a forecast for a place and date. The setup omits radiation, surface and boundary-layer schemes.
- Only one atmospheric profile and one 2 km grid were studied. The reference is another simulation, not measured weather. Agreement with WRF cannot establish real-world accuracy or performance on new storms.
- The reduced model uses a chosen radius closure R = H/π and other physical assumptions. The source says no parameter was tuned to WRF, but the model was developed after the WRF output was available. This is not a blind held-out prediction or proof of a universally valid first-principles derivation.
- The paper’s 11% median discrepancy must not become a blanket accuracy claim. Selected quantities differ substantially: left-moving speed by about +46%, peak vorticity by +53% and echo-area growth by −62%. The plotted comparisons and prose summaries use different selections of quantities.
- The rainfall row labelled “Peak accumulation (2 h)” uses approximately 42 mm from a 27.9 mm/h model rate multiplied by 1.5 hours, versus 64.5 mm after two WRF hours. The source reviewer flagged this and the supplied final manuscript retains it. Its −35% figure is not a comparison over equal durations.
- The reduced-model vorticity profile peaks near 9 km in the supplied arrays. The manuscript caption says its peak matches the 2–5 km layer; that wording is not supported by the supplied profile. The claimed grid-resolution explanation for vorticity disagreement also lacks a finer-grid test.
- The ZIP supplies 12 files for 21 artifact records: eight earlier WRF fields and paper_build.tex are absent. It contains the final WRF field and reduced-model arrays, but no standalone model integration script. The original TeX retains FIGMODEL/FIGVERIF placeholders. This is an inspectable archive, not a complete independently reproduced study.
- The eight-page PDF follows the user’s requested article format; no arXiv publication or independent peer review is established. Session review corrected some issues but did not resolve every scientific or presentation claim. The roughly 90-second solver runtime stated in the paper excludes installation, analysis, writing and review.
The next useful test
Reconcile the rainfall time windows and diagnostic definitions, check the sensitivity to assumed plume radius and WRF grid spacing, then test the reduced model on new atmospheric profiles. Keep a held-out benchmark and measured specialist effort so a future study can establish transfer and time saved.
Selected scientific files
These files support inspection of the study. They are not a complete package of run inputs, dependencies or raw outputs. Scientific scripts are provided for reading; this website does not execute them.
- fig_model.png
- fig_verification.png
- model_params.json
- wrf_supercell_diagnostics.csv
- wrf_supercell_evolution.png
This is an editorial evidence summary of a recorded investigation, including later requests and review. The prompt animation is a presentation of saved work, not a live simulation. Human time saved was not measured.