Particle synthesis · evidence summary
Which ingredient should a particle-synthesis team test next?
An R&D team wants reproducible silica spheres of a chosen size, using TEOS, ammonia, water and ethanol. It needs a useful process lever and an explanation of what sets the final diameter. Later, the user asks specifically for particles above 100 nm and an estimate of their surface roughness. The practical decision is which synthesis condition to vary next and what to measure alongside it.
The research prompt
Selected research prompt excerpt
Create a reproducible simulation of Stöber silica nanosphere synthesis using open-source software. Use: - Cantera for TEOS hydrolysis and condensation kinetics - OpenFOAM’s population-balance model for nucleation, particle growth, and aggregation - Python with SciPy, pandas, and matplotlib for
A recipe hypothesis, with a transfer gap.
The study assembled 209 published measurement rows and connected kinetics to particle growth. Held-out-publication errors of 57–178% exposed the need for local calibration.
The ammonia trend is a conditional recipe hypothesis. Held-out-publication errors of 57–178% show that transfer to a new laboratory remains unreliable.
The recorded investigation
Build the process model and keep its bookkeeping honest
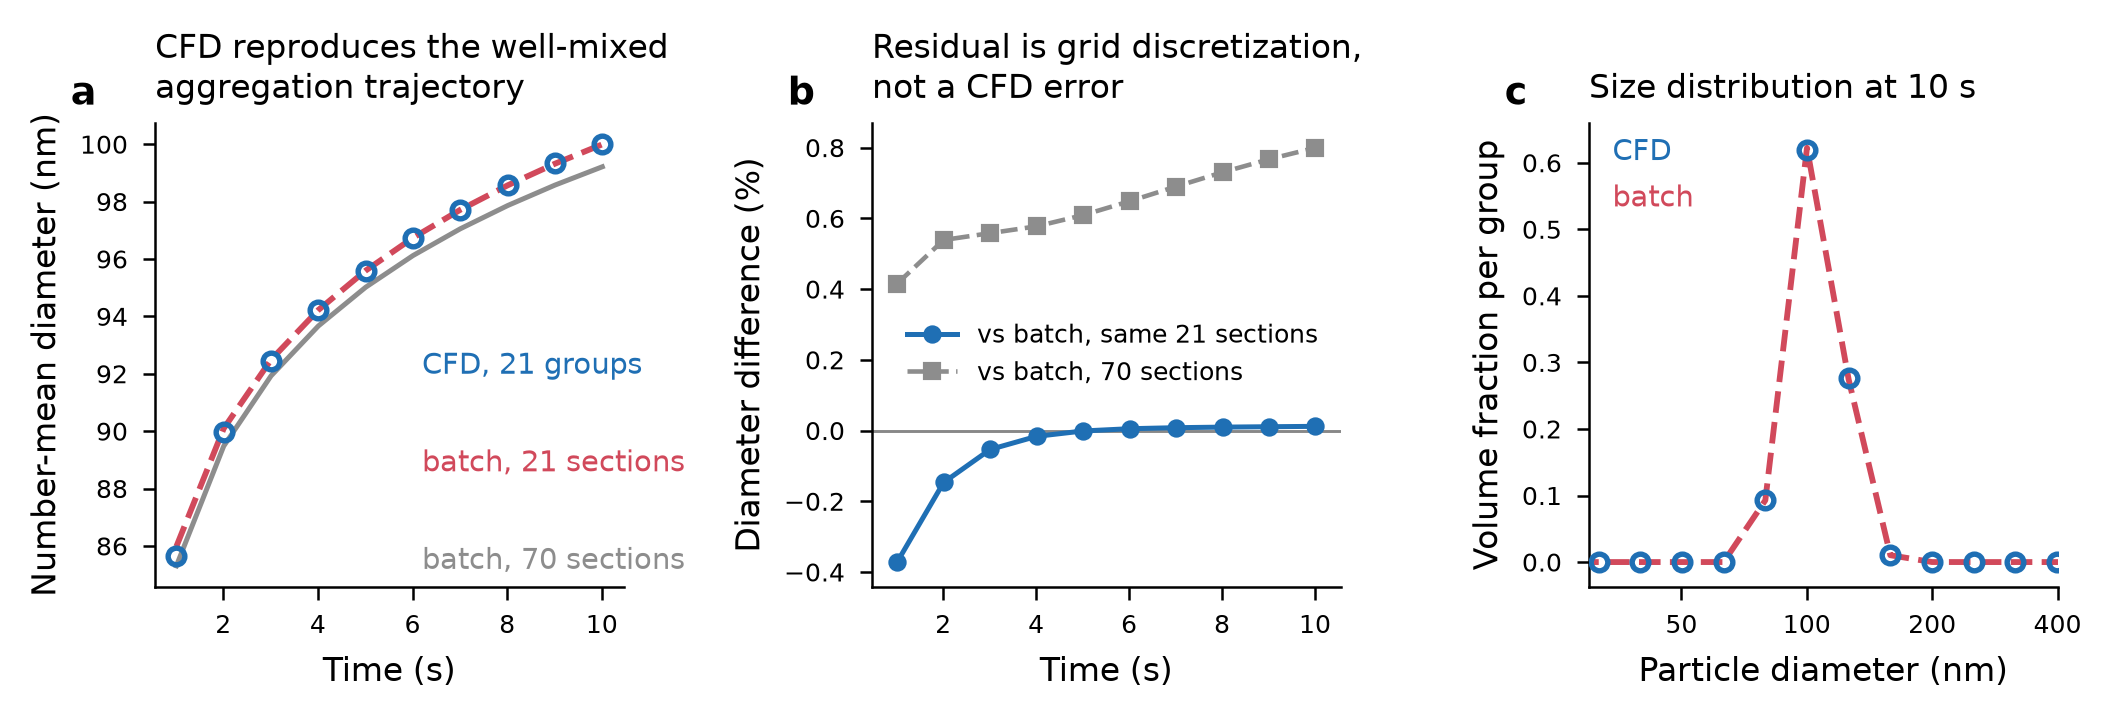
Laplace assembled a reusable simulation package, parameter provenance, tests and figures. It coupled hydrolysis kinetics to an aggregation-based particle population balance, with silicon conservation as a numerical check. A second implementation in OpenFOAM reproduced the mean diameter to about 0.012% at the 10-second endpoint on the same size grid. That supports implementation consistency; two solvers can still share an incorrect physical model.
Find out why a plausible model misses the observations
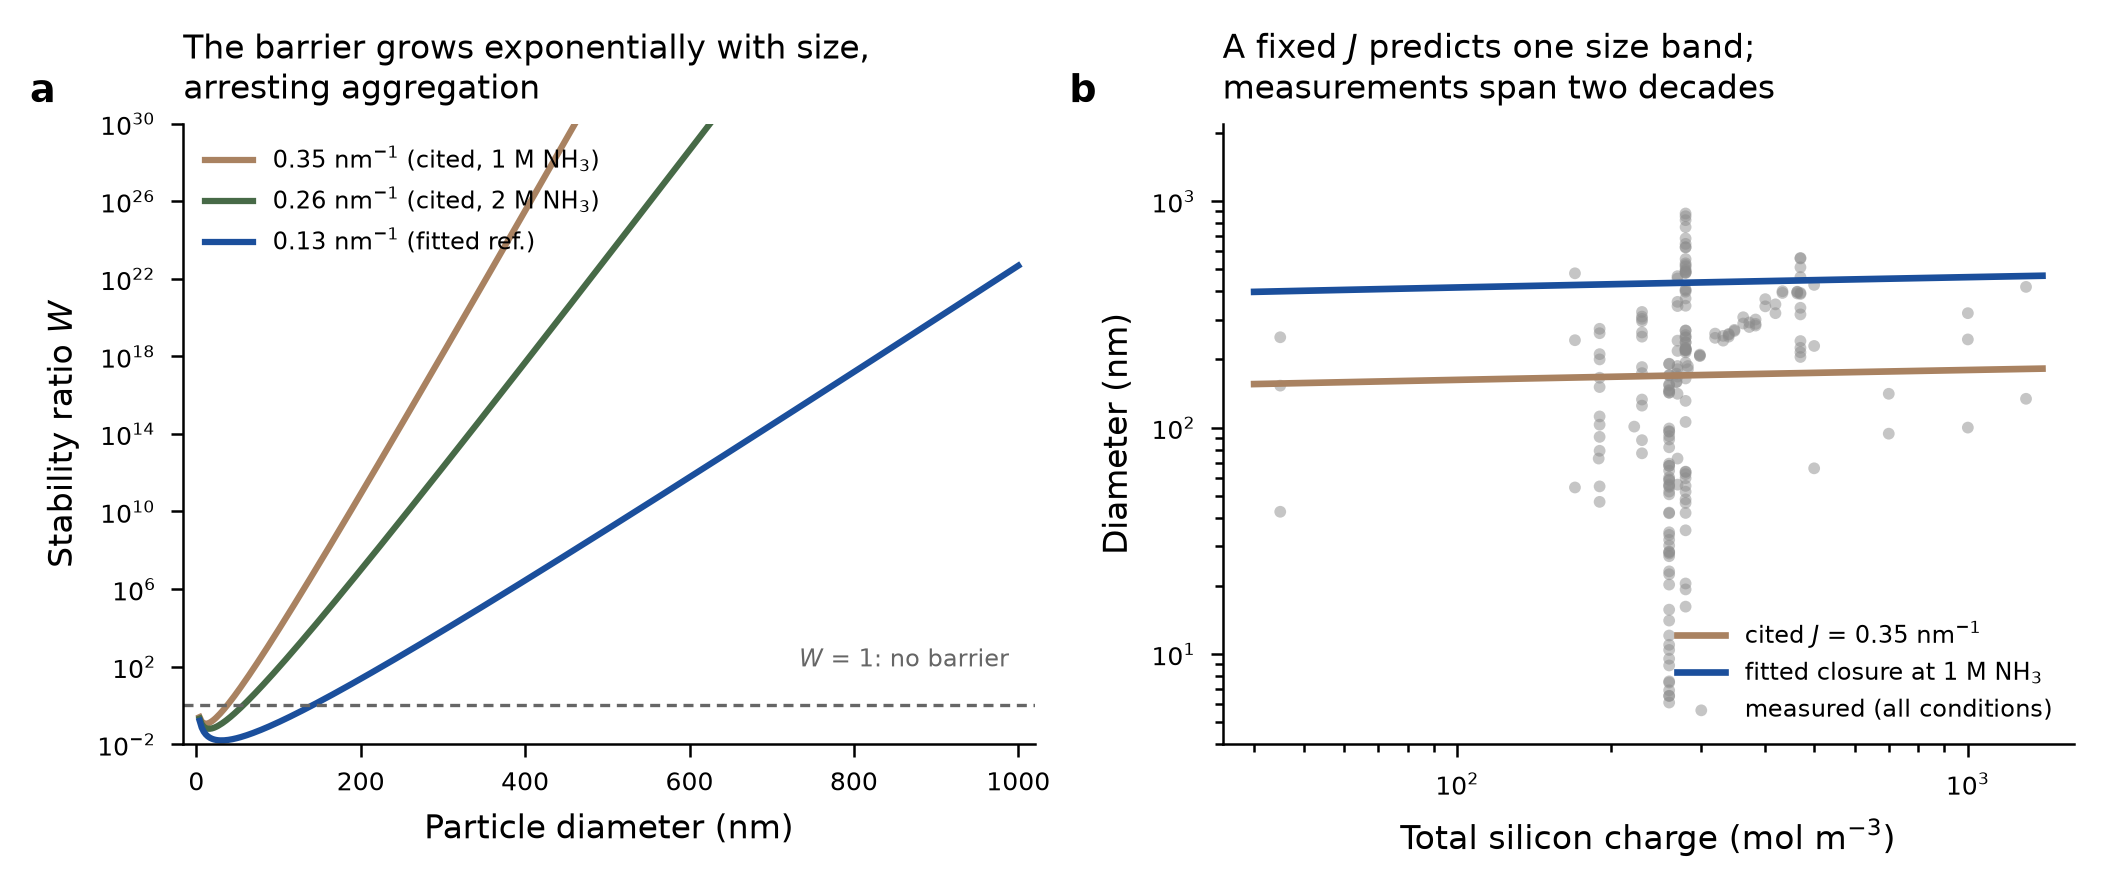
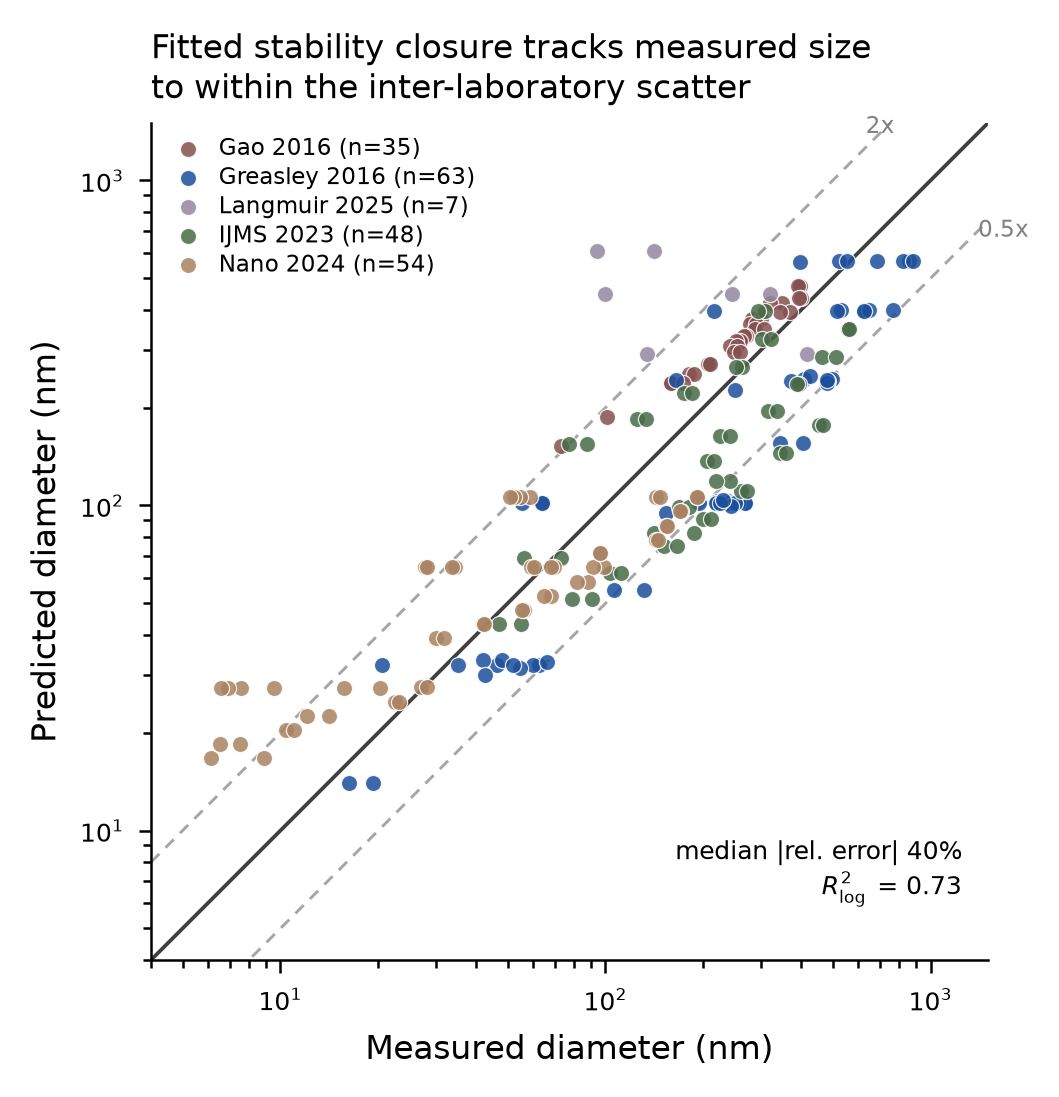
A fixed literature stability parameter produced only a narrow band of diameters, while the assembled measurements spanned much more. Laplace derived how the stability barrier controls the point where aggregation stops, fitted its dependence on conditions, and tested transfer by leaving out one publication at a time. The fit’s 40% median error became 57–178% on held-out publications. That changes the handoff: a fitted literature correlation is not a laboratory-ready recipe.
Translate the model into the next synthesis test
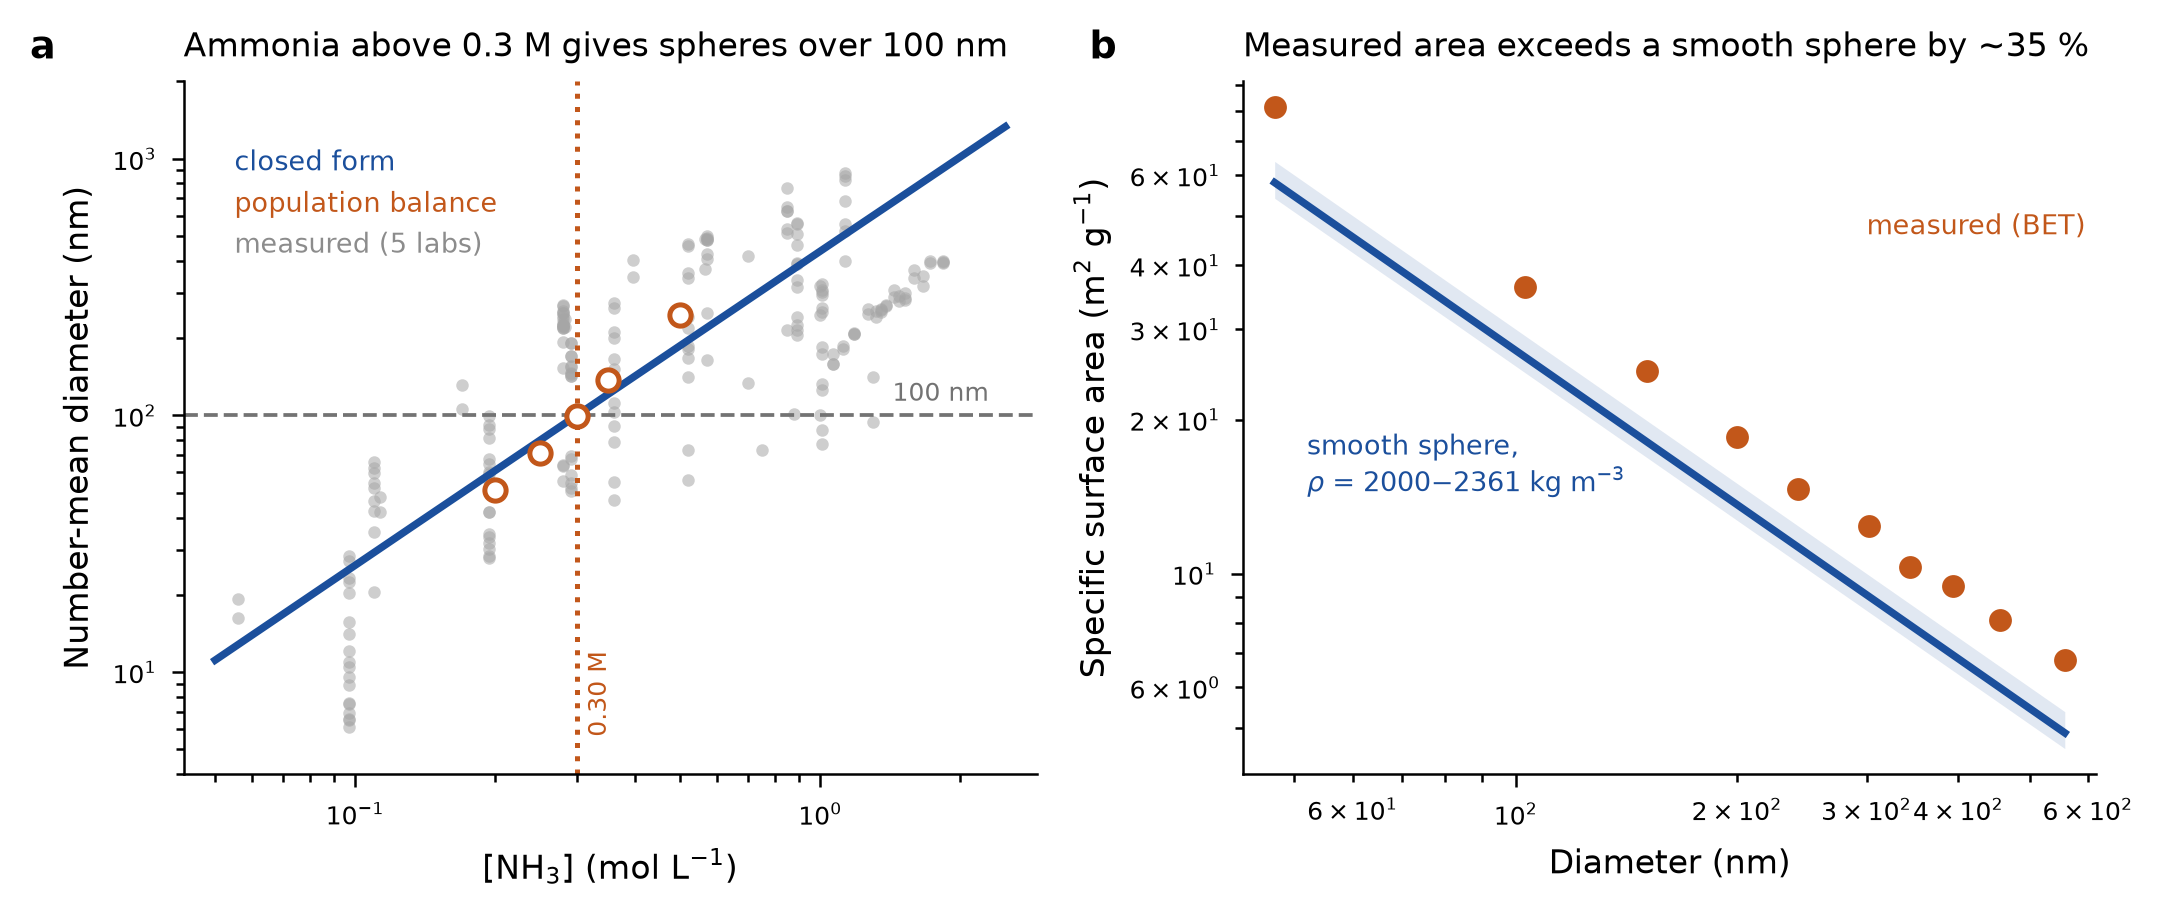
For a specified scenario of 0.28 M TEOS, 6 M water, 25 °C and two hours, the fitted model places the 100 nm diameter crossover near 0.30 M ammonia. The recorded population-balance run gives 99.4 nm at that condition. Within this scenario, ammonia is a useful variable to test. A later roughness estimate came from published surface-area measurements, not from the particle-size simulation, which tracks spherical volumes and cannot predict surface texture.
Where the conclusion stops
- The 0.012% number is agreement between implementations at one 10-second endpoint. It is not experimental accuracy, whole-run agreement or validation of the final arrest size.
- The 40% median error is in-sample. Held-out-publication median errors range from 57% to 178%; the fitted recipe hypothesis needs controlled local validation.
- The nominal 0.30 M ammonia crossover applies to a fitted scenario with fixed TEOS, water, temperature and time. It is not a validated production recipe or a general threshold.
- Distribution widths do not converge with the size grid and remain upper bounds. Some reaction coefficients have no source; condensation is disabled and the unsupported classical-nucleation route does not run.
- Surface roughness was inferred from one publication’s BET surface-area data and assumed density; internal porosity and external texture are confounded. No atomistic roughness simulation or ReaxFF trajectory was completed.
- The separate sodium-silicate/sulfate export shares a project ID but has cancelled status and zero artifacts. Its promised workflow is not a completed result and does not establish sulfate effects for this TEOS-based case.
The next useful test
Run a controlled synthesis series in one laboratory, varying ammonia and measuring both time-resolved size and particle number. Those observations can separate kinetics from aggregation effects and test whether the literature-derived crossover transfers. Characterise porosity and external texture separately before using the surface-area estimate as roughness.
Selected scientific files
These files support inspection of the study. They are not a complete package of run inputs, dependencies or raw outputs. Scientific scripts are provided for reading; this website does not execute them.
- cfd_vs_wellmixed.csv
- cfd_vs_wellmixed_2.png
- cross_validation.csv
- experimental_data.csv
- fig_diagnosis.png
- fig_parity.png
- fig_size_roughness.png
- fit_predictions.csv
- fit_summary.json
- roughness_bet.csv
- threshold_scan.csv
This is an editorial evidence summary of a recorded investigation, including later requests and review. The prompt animation is a presentation of saved work, not a live simulation. Human time saved was not measured.